Labor cockpit overview
What is the Labor cockpit?
The Labor cockpit is where department heads manage their staff schedules.
The Cockpit provides details on hours, productivity and labor cost both for past and future months. It includes hours imported from your time keeping system (TKS), recorded in the PMI Schedule or entered manually.
There is a Labor cockpit for each department in PMI. They display all relevant information to assist department heads with managing staff schedules according to the needs of their department.
You can also compare schedules to the SMART Forecast – a recommendation of the daily allocation of hours if you are going to meet the month productivity/hours forecast set.
Key terms for understanding the cockpit
Primary cost driver
The main factor that drives labor hours and cost in a department.
For example, the most common cost driver for housekeeping is room nights since the number of rooms occupied will drive the need for labor hours, and thus labor costs, in this department.
The following are examples of standard primary cost drivers, although this may vary dependent on your property’s set-up:
- Front office: rooms occupied tonight
- Housekeeping: rooms occupied last night
- Breakfast: number of covers (guests eating breakfast) or guest nights previous day.
- Restaurants: revenue
Cost drivers can be set and changed from the Tools menu (if you have the user rights). The cost driver uses the last saved Live forecast data.
Productivity/Hours Forecast
A monthly forecast that is used as a goal for how many hours the department should use.
Productivity is the output per labor hour. For example, if in housekeeping, 2 rooms should be cleaned in 1 hour, the productivity forecast will be 2. If there are 100 room nights scheduled, then you would expect to use 100 divided by 2 = 50 hours.
Hours forecast is the total number of hours the department expects to use during the month. This is static and will not adjust based on the hotel’s activity.
All departments submit either a monthly hours or productivity forecast. Usually, operational departments (F&B, housekeeping, etc.) use a productivity forecast, and admin departments use hours forecasts, as their schedules do not change depending on activity levels at the hotel.
SMART Forecast
A recommended allocation of daily hours to meet the monthly hours/productivity forecast set.
Staffing guide
A recommendation of how many labor hours to schedule each day for each department based on historical trends. This is only available if enabled for your property.
How to use the cockpit
There are 2 task flows PMI recommends when working with the cockpit. Completing these consistently will ensure that the data recorded is accurate, and allows you to adjust future schedules optimally, ensuring there is always enough staff on hand to manage the workload without overstaffing.
Daily:
- Confirm yesterday’s hours are updated.
- If something noteworthy happened or you used significantly more or less hours than forecast, add a comment.
- E.g. Staff on sick leave – had to bring in cover, staff training, etc.
- Comments will also be visible to management from the Management Perspective.
- Review schedule for next 2-4 weeks compared to SMART forecast. Adjust as needed.
Monthly:
- Review last months results – did you meet the productivity/hours forecast. Were there any major discrepancies from the SMART forecast. Consider why that may have been.
- Look ahead to next month. Are there any changes needed in the forecast? If yes, update in Budget and forecast module.
- If you aren’t sure what a realistic forecast is, use the staffing guide as a starting point.
- If you are working with a timekeeping system (TKS), all changes in hours, past or future, must be done there and not in PMI. If you are working with PMI’s scheduling module, make any changes in the cockpit for the past, or update the schedule for the future.
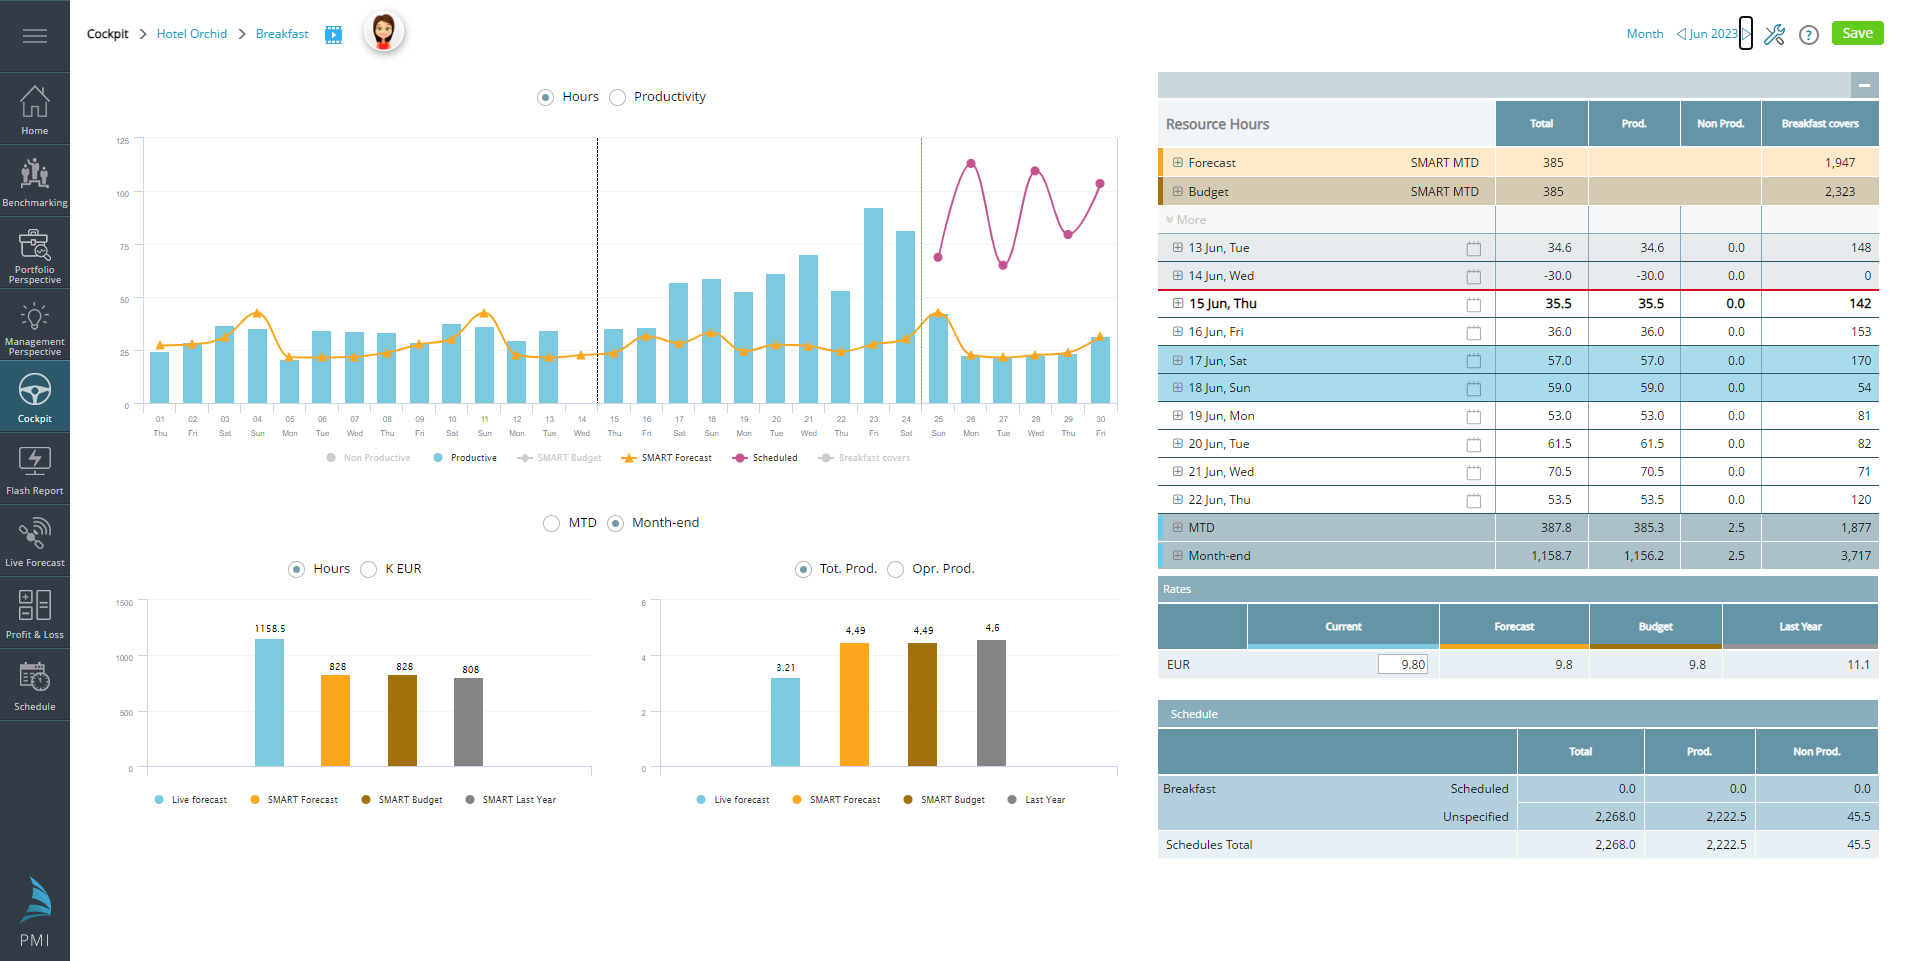
What is shown in the labor cockpit?
All active cockpits can be accessed by clicking on the department icon on the home page, using the quick link on the left, or via the main menu.
The status of each cockpit is colour coded:
- Green plus sign: the Cockpit has been updated today and is using fewer hours than the productivity/hours forecast Month to Date.
- Yellow question mark: The cockpit is not updated with yesterday’s results. It is recommended that all cockpits be updated before 10 AM.
- Red minus sign: The cockpit is updated, but more hours have been used than the productivity/hours forecast Month to Date.
TIP : A discrepancy of more than 50 hours suggests the monthly forecast was unrealistic and the forecast for future months may need to be adjusted.
")
The day-by-day graph
The main graph gives a daily breakdown of hours worked/scheduled compared to SMART Forecast. This can be used to help plan future schedules according to the activity levels of the hotel.
There are 2 view options: Hours or Productivity.
Click the legend items below the graph to show or hide details from the graph.
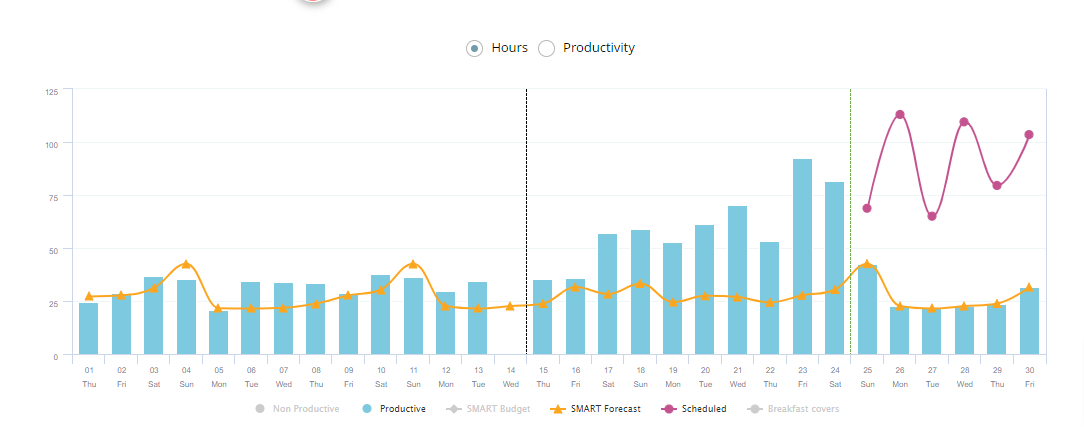
- Black vertical line: Seperator between the past and the future. This line always shows at today’s date.
- Grey vertical line: Schedule horizon. All departments should have a schedule in place up until the schedule horizon line as a mininum. The horizon can be adjusted in settings depending on access rights.
- Non-productive: Paid absence hours: i.e., paid sick leave, training or off-duty meetings. Bars in the past show actual hours. Bars in the future show scheduled hours.
- Productive: Bars in the past show actual hours. Bars in the future show scheduled hours.
- SMART Budget: The number of hours you can schedule each day if you are to meet your productivity/hours budget.
- SMART Forecast: The number of hours you can schedule each day if you are to meet your productivity/hours forecast.
- Scheduled: These are hours that are in the schedule. They appear as a pink line after the horizon. After the horizon the blue bars show the SMART hours, not the scheduled.
- Staffing guide: PMI’s recommendation of staffing based on historical trends and the forecasted activity at the hotel. This legend item only appears if activated for the property. Contact support if you would like this activated.
When Productivity is selected:
- The blue bars show the average productivity per hour.
- The yellow line shows your productivity forecast.
TIP: You should not expect to be exactly on the productivity line everyday, but accumulated for the month, you should be as close as possible.
Resource hours table
The table on the right gives a daily breakdown of the month’s schedule, and the primary cost driver details.
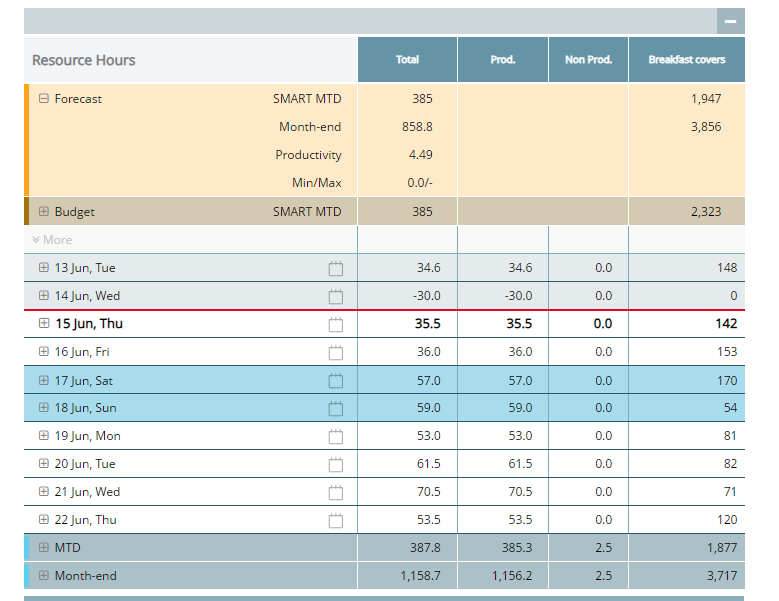
- The monthly forecast is expanded/closed by clicking the +/- signs on the left.
- SMART MTD: The number of hours SMART forecast suggests month to date.
- Month-end: The total forecasted hours needed for the month. This is a static number and should not be changed during the period. The forecasted cost driver divided by the productivity target gives the forecasted hours.
- Productivity: The monthly productivity forecast.
- Min/Max: The minimum and maximum number of hours to set on any day, as set in Tools. When activated, the SMART forecast will not suggest fewer or more hours than the set min/max.
- The budget section shows the budgeted hours and productivity, both forecast and smart.
- Prod: Productive hours worked/scheduled.
- Non prod: Non-productive hours worked/scheduled includes all paid hours where standard work was not done. I.e. sick leave, training, fire alarm etc.
- Vacation days: Paid time off for full time employees should be ignored in PMI. Paid time off is accrued every working month during the year. When an employee takes their paid time off, there is no additional cost to the hotel for that month because it has already been set aside.
- Breakfast covers: The manual primary cost driver at this property. This will vary depending on the set up of the cockpit and the department. In a housekeeping cockpit, the primary cost driver would be room nights.
- On past days this shows the actual result
- On future days it shows the Live forecast
- Other cost drivers: These columns are for information purposes only.
- Red line: Indicates today’s date. Click the plus sign for more details of the given date. The data available will vary dependent on property set up.
- Red figures in the Room Nights column indicate that the number of rooms are above the capacity for that date. If the Forecast, Budget or Live forecast are saved above the capacity, the figures will appear in red.
- Red input boxes means the hours for this day have not been saved.
- Comments: Click the note icon to add a comment to explain discrepancies or special incidents that are worth explaining. These comments will be visible for management to view in the Management perspective. Do not write any names in the comments since these are visible to everyone and are not relevant to staffing or productivity.
- MTD: The actual hours worked month to date
- Month-end: Actual hours worked month to date + scheduled hours for the rest of month
Summary graphs
On the bottom of the page, there are two graphs showing a summary of hours, labor cost and productivity for the month selected. These can be used for a quick overview of the month totals.
There are 2 view options for the bottom graphs
- MTD: Month to date figures i.e. actual result so far
- Month-end: Live forecast, i.e. actual plus forecast (scheduled) for future days
The comparative bars for Forecast, Budget and Last year all follow the SMART logic. This is calculated by taking the actual activity and dividing it by the budget/forecasted productivity.
Last year is calculated by dividing last year’s productivity and this year’s activity, to give a valid comparison to the current activity.

The graph on the left displays the actual number of hours compared to SMART Forecast, Budget or Last Year. Hover over the bar to see the split of productive and non-productive hours.
Currency will show the accumulated labor cost, calculated using Average rate x hours recorded in the cockpit.
The graph on the right shows the total productivity (output per hour), including non-productive hours. Opr. Prod includes only the operational or productive hours.
For Housekeeping cockpits there is an additional view option ‘Show consumption’ which can be added from Tools. This displays how many minutes are used to clean rooms on average.
Rates
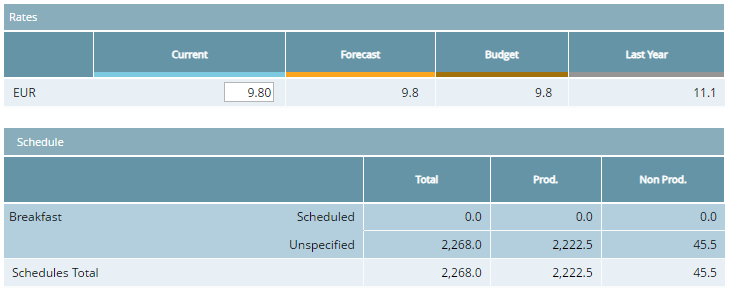
Rates are the average cost per hour including social costs, excluding bonuses (this might differ from company to company, depending on individual policies). The rates are only visible for the cockpit owner and administrative staff.
These are calculated by dividing total labor cost for the month by the hours. Forecast and Budget rates can be adjusted in the Budget and Forecast Module. Read more about labor cost handling in PMI.
Below Rates you see the schedules created for this Cockpit. It shows an overview of total scheduled and unspecified hours, as well as productive and unproductive labor hours. View a schedule by clicking on its name.
Outsourced departments
If a department is fully outsourced and you have no influence over the hours, you can set the cockpit to update automatically. No hours will be imported when using this function. PMI will populate yesterday automatically by dividing the cost driver by productivity target and save. The Horizon will be set to zero days so you can only see SMART hours for the future. There is no option to make any manual changes to the Cockpit or hours. Please contact support@d2o.com to activate this.
Tools
The tools menu gives several options to adjust how the Cockpit works in a specific department. Depending on your user rights, you can set cost drivers, add schedules, change seasons, amend horizon days, enable TKS, and enable express move hours between departments, etc.