Flash report overview
What is the Flash report?
The PMI Flash report gives you a total overview of the daily revenue, both actual and as per the Live forecast. The main users are GMs, controllers, revenue managers and heads of departments. For optimal results, the Live forecast should be updated daily.
How to read the Flash report
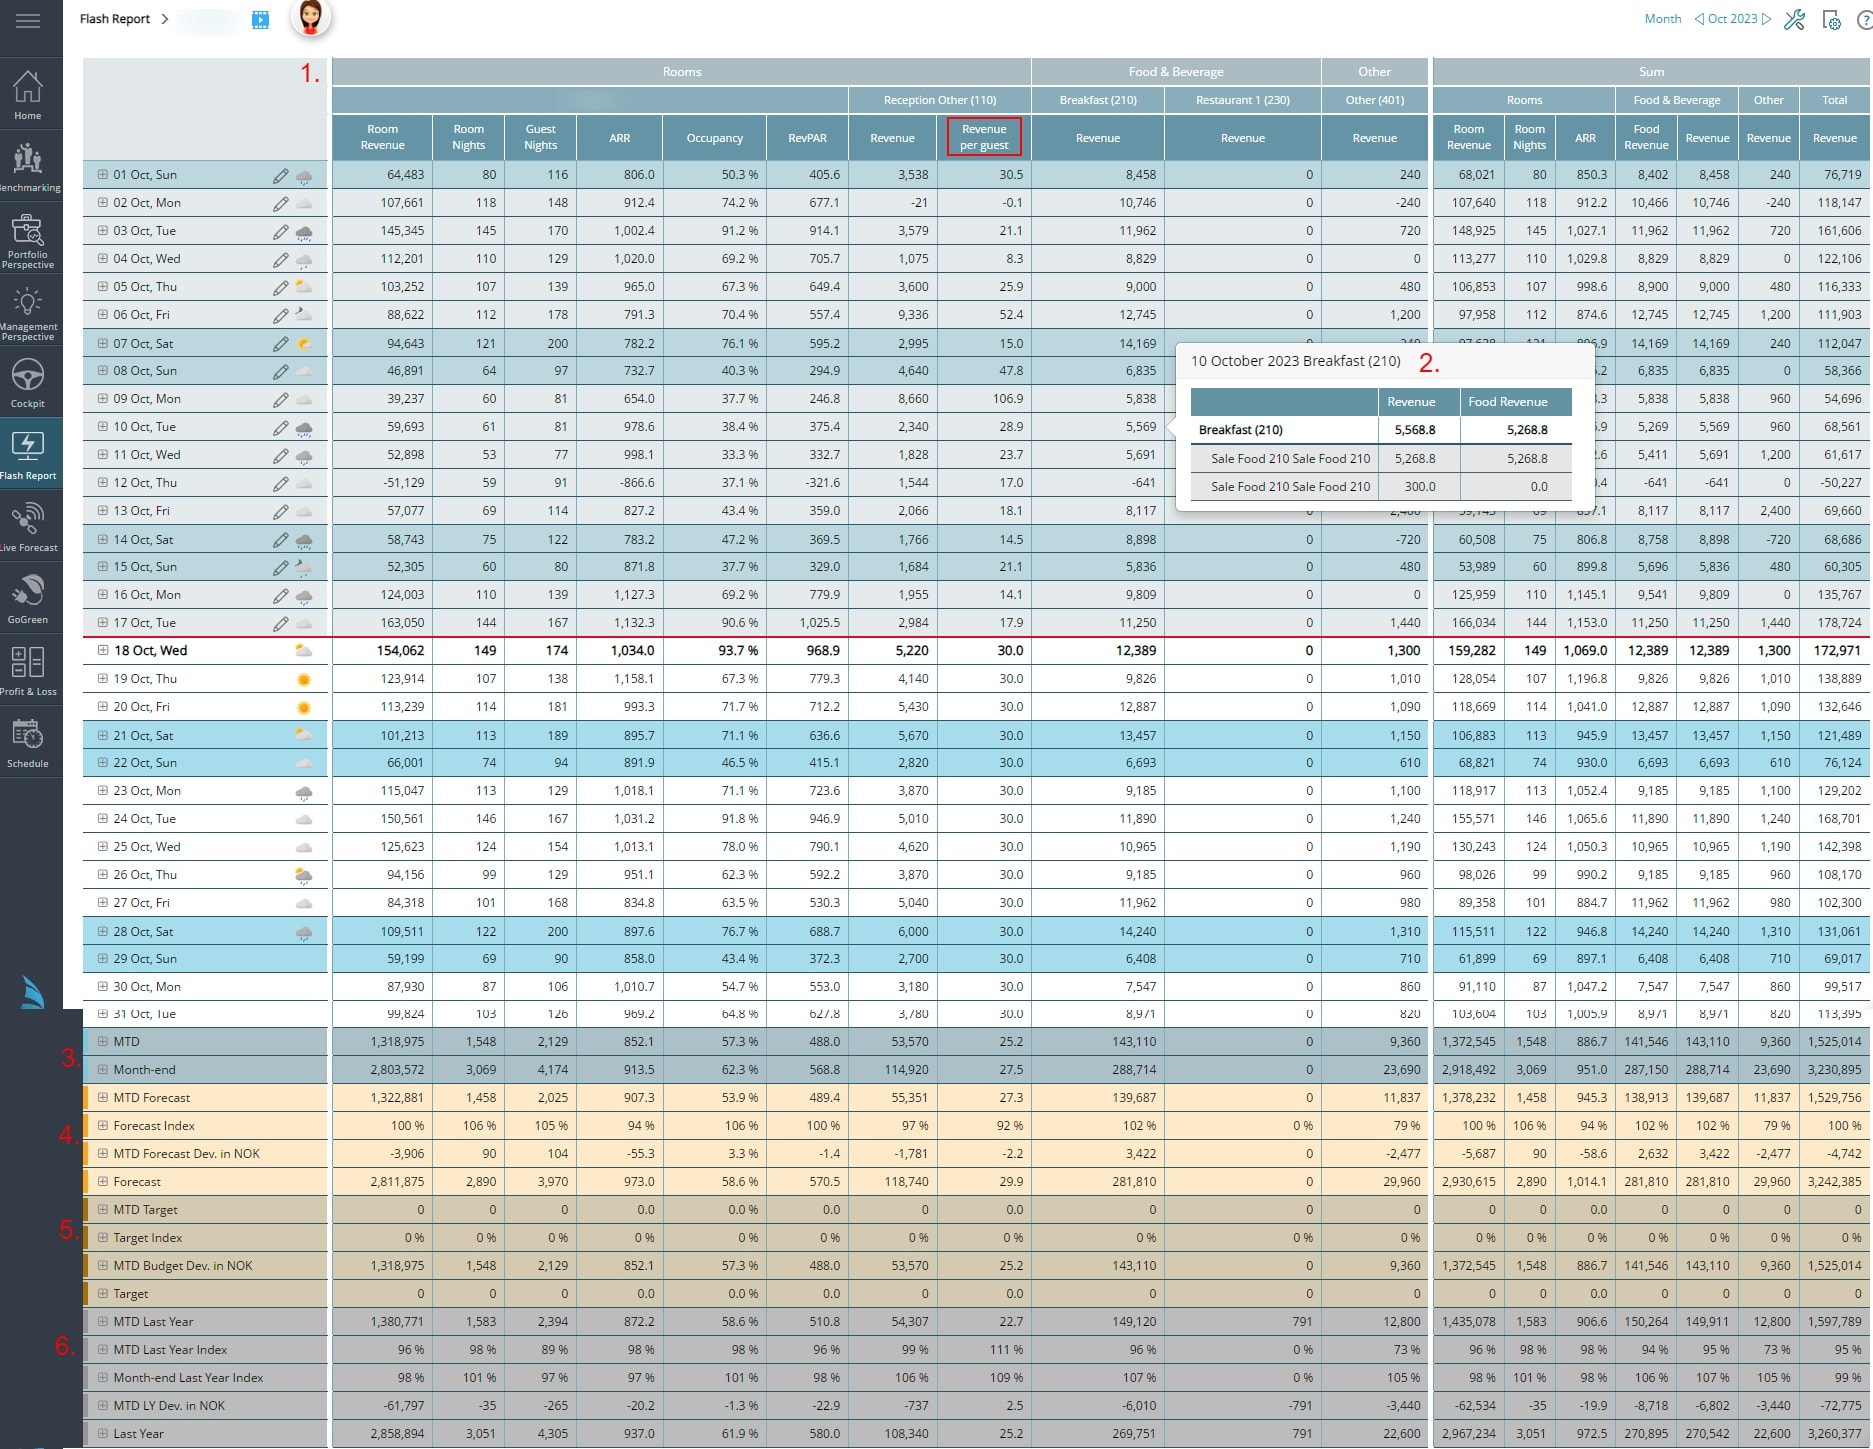
The Flash report consists of both actual figures and Live forecast figures. Up until yesterday’s date, you have actual figures, and from today and moving forward to the end of the month, the figures are from the different Live forecasts. Today’s date is marked with a red line.
- The report shows the different divisions and a total Sum at the far right of the sheet.
- By clicking on any actual figure, a popup will show you the import from your PMS or POS system with the actual accounts imported and the revenue. This will only work on historical (actual) figures and not on future dates, since future dates are Live forecast.
- MTD (month to date) consists of actual imported figures from PMS or POS. Month-end consists of both actual figures and Live forecast.
- MTD Forecast is the amount you should have by this point in the month/period, in order to reach your end-of-the-month forecast, given that your Live forecast for the rest of the month is correct. The calculation is month-end Forecast divided by month-end Live forecast x MTD actuals. If the MTD actual is higher than this amount you will exceed the forecast and vice versa. The Forecast index is calculated by taking the month-end figure and dividing it by the forecast figure. The index indicates where you will end up month-end compared to the forecast. Deviation is also displayed in local currency.
- MTD Budget is the amount you should have at this point in the month/period in order to reach your monthly budget, given that your Live forecast for the rest of the month is correct. The calculation is month-end budget divided by month-end Live forecast x MTD actuals. If the MTD actual is higher than this amount you will exceed the budget and vice versa. The Budget index is calculated by taking the month-end figure and dividing it by the budget figure. The index indicates where you will end up month-end compared to the budget. Deviation is also displayed in local currency.
- MTD or period-to-date last year: Note that with By Weekday comparison, instead of By Date comparison, the sum is based on comparable days. E.g. if the first day of the current month is a Monday, PMI will start on the corresponding Monday last year to calculate last year´s result. Thus the month end result shown for last year might differ from the actual calendar month´s result. For example, PMI will compare this year’s Easter with last year’s Easter even though last year’s Easter may have fallen in another month. When comparing By Date you will compare the date this year to exactly the same date last year. See View Options for alternating between By Weekday and By Date. Deviation is also displayed in local currency.
Editing
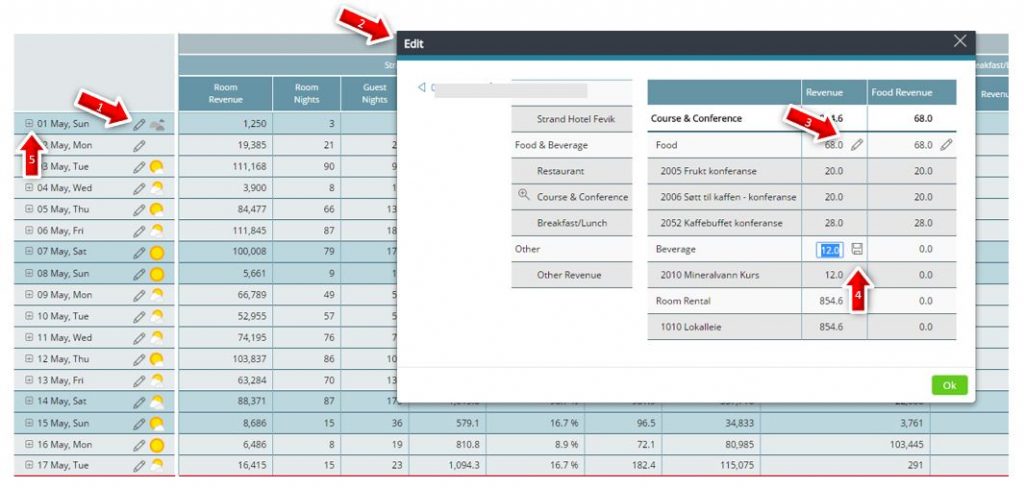
In this report, you may change the figures if they are incorrect or if a larger adjustment to a revenue posting has been made that will impact staffing levels if adjusted on a day other than the actual day of revenue. You must have the user rights to edit the Flash Report. A reason for editing could be that revenue was registered on the wrong day in PMS or POS. To get correct historical data, you may remove that revenue from one day and add it to another day. You may also use this function when entering data manually, i.e if you are without integration to a PMS system.
- Click on the pen next to the date.
- A new window will open and you can change the date using the date selector.
- To edit, click the pen icon next to the department or segment you want to change.
- Edit the figure and then click the Save icon to confirm. Be sure to click the green OK button in the bottom right corner of the pop up window after finishing.
- When editing a value on a department or segment, the imported accounts will be deactivated for that day and replaced with a manual correction. You can reset to the original values by clicking the trash can icon.
Use the date selector to choose the date you want to see/change.
How to manually enter covers on a daily basis
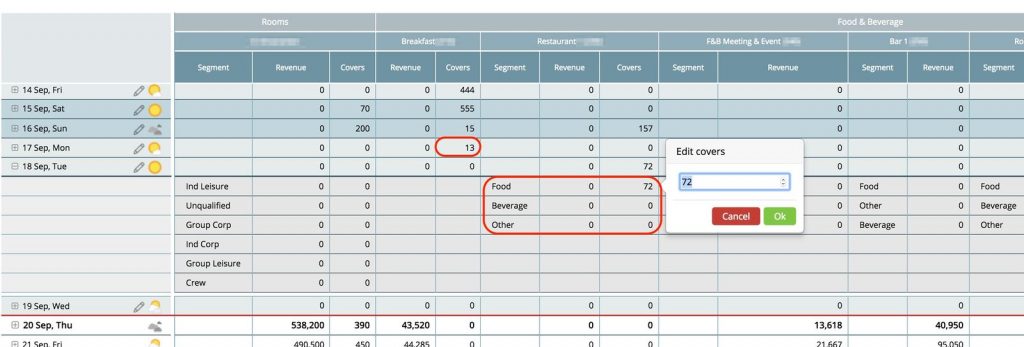
If you have your Live forecast based on covers and you do not have an import of actual covers, you can manually enter them directly in the Flash report without having to use the pen/edit function.
Double click on the date you want to add covers on. If you have segments, you will need to edit on segment level.
Tools
Under the Tools menu, you have the option to export the report to Excel or PDF format.
View Options
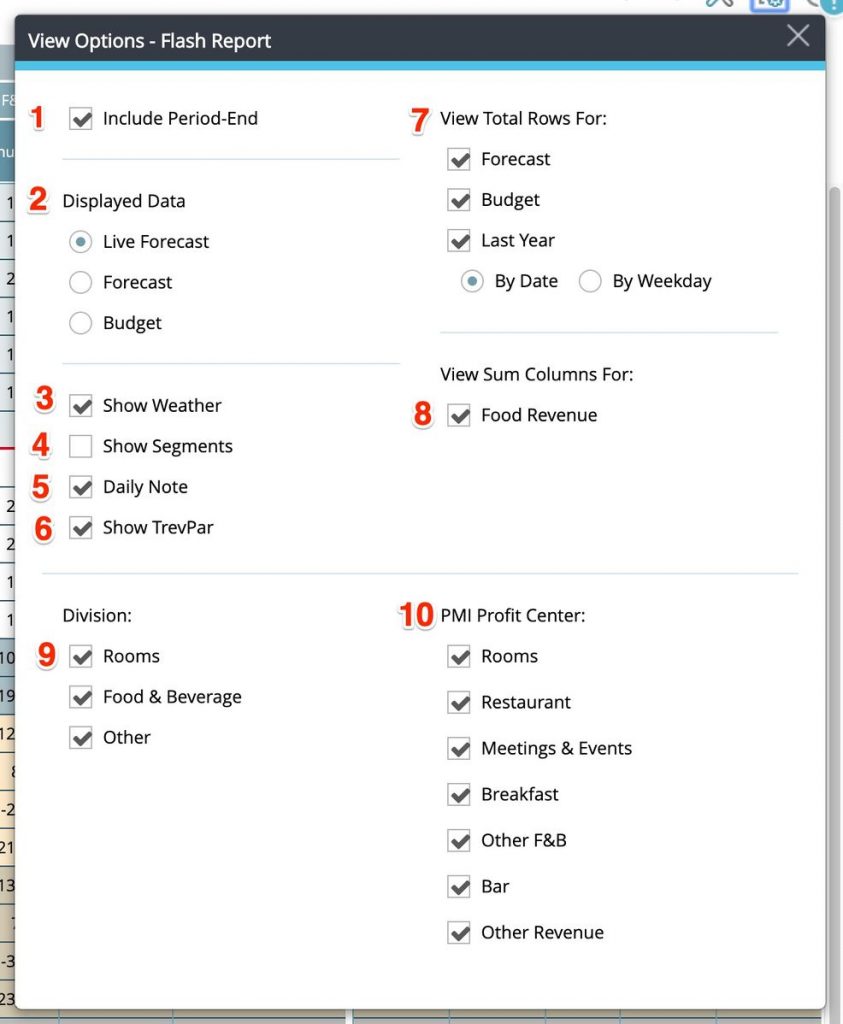
In View Options, you can choose what you want to display.
- Include Period End − This will include Live forecast.
- Displayed Data − You have the option to see Live forecast, meaning actual and Live forecast figures joint, Forecast figures (last submitted forecast) only and Budget only. The Summary at the bottom will always show actual and Live forecast figures.
- Show Weather − If chosen, you will see a weather icon for the next 10 days. Also, the weather data will be saved for historical reference from that day onward.
- Show Segment − This will display the segments of your property if applicable. You can also activate the segments by clicking on the + sign in front of the date in the main view.
- If you would like to to display the KPI Revenue per guest, this column will appear after Revenue under Reception Other. (Please see the image of the flash report at the beginning of this article for reference.) If covers has been activated in that department, the calculation is revenue divided by covers. If guest nights has been activated in that department, the calculation is revenue divided by guest nights. The name of the column will remain Revenue per guest, regardless of whether guests or covers have been activated. Please contact support to have this activated for you.
- Daily Note− Will display daily notes.
- View TrevPar – This will add a column under Rooms displaying TrevPar. This is total revenue divided by available rooms.
- View Total Rows For Forecast, Budget and/or Last Year − This will add comparison totals at the bottom of the sheet. When comparing to Last Year, you can choose between By Weekday (then PMI will compare to the same period last year, i.e not the exact same dates but the same weekdays) and By Date (PMI will compare the exact dates).
- View Sum Columns For Food Revenue − This will show the Food Revenue both under the column Food & Beverage and under the column Other, if applicable.
- Division − This enables you to select viewing a certain Division only.
- PMI Profit Center − You may also select what to display at the profit center level .
Recommendations
When PMI alerts you that there is a deviation, this means that the deviation is real unless you initiate prompt actions. The scenario can be changed by amending your Live forecast. The focus should be on “what needs to be done” rather than on “if we will make it by the end of the month or not”. It is suggested to use this report in departmental meetings and post it in the back office for frequent reference.


