Live Forecast Overview
What is the Live forecast?
The Live forecast in PMI is a daily revenue forecast. It is a rolling forecast which should be updated daily depending on the latest expectations due to changes in the market, new reservations, cancellations, etc.
A Live forecast is created for all areas of the business that generate income. This includes room revenue, food & beverage revenue, and other revenue.
The Live forecast updates with actual data for past days, and current Live forecast for future days. This differs from the standard monthly Forecast in PMI, which, once set, does not change.
The Forecast serves as a monthly goal or target. The Live forecast allows you to track whether you are on pace to meet the monthly Forecast. This gives you opportunity to adjust your short-term plan during the month for a greater chance of meeting your goal.
What is the purpose of the Live forecast?
There are 3 main functions of the Live forecast:
- Provides a reliable and up to date 12-month forecast.
- Allows you to track how you are pacing month to date in relation to your month end goal (monthly Forecast).
- A reliable Live forecast allows you to effectively plan other resources using this forecast as a basis. For example, staffing in housekeeping and food purchases for breakfast.
It is PMI best practice to have a Live forecast in PMI for a minimum of 12 months. When a month has ended, update the Live forecast for the same month next year.
This ensures that the property has an updated sales forecast and target for the coming year that covers annual seasonality. With a 12-18 month’s forecast, you are better prepared for the upcoming budget period. PMI Prediction will always forecast the next 16 months rolling.
How is a Live forecast created?
The way a Live forecast is created is dependent on your property’s Live forecast configuration settings. There are 3 main set up modes:
- PMI Automation (PMI prediction and machine learning drivers): The Live forecast is automated based on either PMI prediction or machine learning drivers, depending on department type. There is an option to manually override the prediction for a specific day by using the Pickup/Adjust column.
- Import: The Live forecast is imported daily from an external source. Here is an option to manually override the prediction for a specific day by using the Pickup/Adjust column, until a new forecast is imported.
- Manual: No automatic forecasting is used. The user needs to manually input forecast values for all days.
How to use the Live forecast?
Regardless of which Live forecast option is being used, there are 3 main actions to be taken in the Live forecast module for each department:
Daily: (5 minutes)
- Check yesterday’s actual result compared to the last saved Live forecast. Add a comment if needed.
- Review actuals compared to last saved Live forecast month to date.
- Check the pick-up column for future days to verify that they are realistic. Adjust as needed.
- Save changes
Weekly: (30 minutes)
- Check Live forecast for the next 3 months. Make any adjustments needed and save. (30 mins)
Monthly: (1 hour)
The Rooms live forecast should always be updated first, as most departments base their driver-based forecasts on the rooms department forecast.
Navigate to Live forecast via the sidebar on the home page or in the main dropdown menu.
- Select the relevant department.
- Select the month or period to view.
- Pickup statistics – Click the icon to view and analyze the booking pattern for different segments and average room rate (ARR).
- Tools – Use this to adjust the Live forecast setup, copy Live forecast to Forecast, and export data. Access will vary depending on user rights.
- View options – Choose what information you would like displayed in the Live forecast table. The options available may vary depending on the Live forecast setup.
Live forecast table
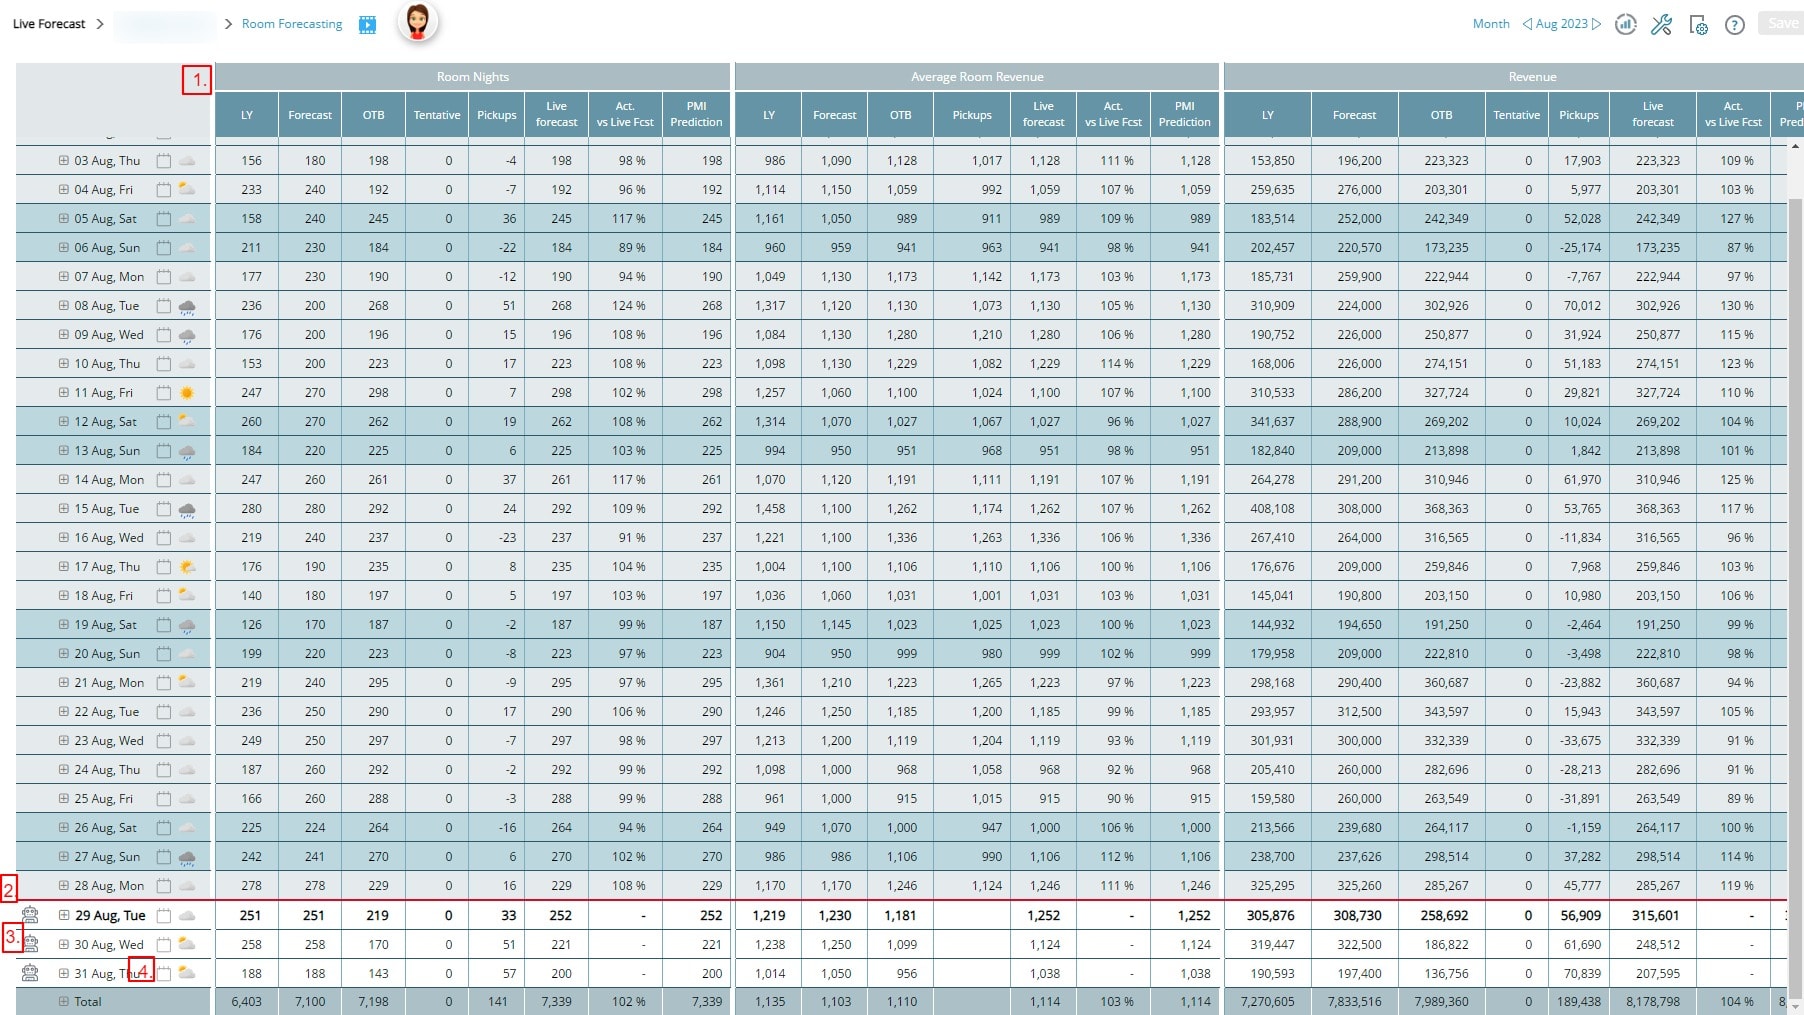
- The columns showing will vary depending on set up, selected department, and view options selected. Hover over a column to view a tooltip explaining which data is being shown. Hover over any number in the graph to see more details about that number. Double click on a future day in the PMI predection column to get a more detailed popup.
- The Live forecast and PMI prediction columns show actual results for past days.
- Red line – Indicates today’s date. Days above the red line are historical and cannot be edited. Days below the red line are future dates and can be adjusted as needed.
- Icons – Indicate how the day’s Live forecast was created.
- Person – Manually updated
- Robot – PMI Prediction is being used in Room live forecast. For other departments, it indicates the driver-based forecast is being used.
- To edit an automated row, click the robot icon and manual edits will be enabled.
- If in a driver-based forecast, selecting the robot icon will remove the driver-based value from the Live forecast. Input your desired value in the pickup column.
- Person with a cog – A manually created driver has been used. This is applicable only in driver-based forecasts.
- Paper with arrow – Forecast is imported from external file.
- Red triangle – During the last update, no historical data was found for this day. The forecast needs to be manually input for this day.
- Comments – Click to review and add comments to a specific day. Use this to note any deviance from normal volumes and rates. These comments will be retrieved next year from matching weekdays. Days with comments are marked with note pad icons.
How to edit the Live forecast?
- The only editable columns in the Live forecast are the pickups columns on future days.
- For past days, the pickups column shows the difference between the actual result, and the last saved Forecast. The Live forecast column shows actuals for past days.
- If your property has a segment level Live forecast, click the plus sign by the date to view the segments and update the date. To make segments visible at all times, select this in the View options.
- Insert a positive number to increase the Live forecast by that amount. Insert a negative number to reduce the number by this amount.
- For Average room rate, the use of the pickups column depends on the configuration setting ‘Use ARR pickup calculator for manual forecasts’ in configuration settings from the tools menu. If enabled, the average room rate pickups column will only apply to the room nights entered in the pickups column. For all other room nights, the OTB Average room rate value will be used. If it is disabled, the Average room rate in the Pickups column will apply to all room nights.
- Once you have made changes, don’t forget to press save.
Color coded figures
Blue = The PMI prediction is constrained by the capacity.
When a number is in blue, this indicates that PMI predicts that the property could sell more rooms than the max capacity. If you hover over the number in blue, the tooltip will show how many rooms it predicts could be sold. In the example above, the hotel has 169 rooms available, but on the 11th, PMI predicted that they could sell 175 rooms if that many rooms were available.
If you hover over the blue figures in the PMI prediction column in the Revenue section to the far right, you can see the difference in revenue that there could have been from selling the extra rooms.
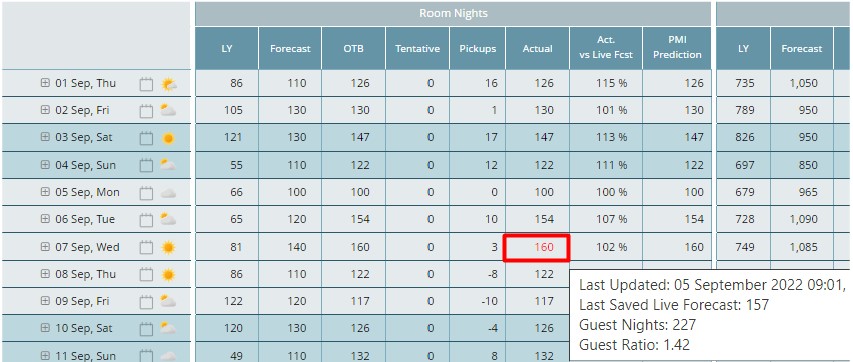
Red – The number of rooms are above the capacity for that date.
If the Forecast, Budget or Live forecast are saved above the capacity, the figures will appear in red. If you hover over the red figures, a tooltip will display the maximum capacity, compared to what was imported and saved.
Purple – The day is a holiday.
The Last Year column will be purple for the holiday dates it fell on last year, and the equivalent dates it falls on in the current year. I.e., the holiday’s results from last year will be shown twice, both where it actually was as well as where it will be this year.
In the example above, Ascension Wednesday fell on a different date last year, and is displayed in purple twice, both on the date it occurred last year and the day it occurred this year.
Orange – There is not enough valid source data found for a standard forecast. It is recommended to manually adjust the forecast for this date.
If the PMI Prediction value transitions from orange back to black, you can re-enable automation.


