What is Room revenue planning?
Room revenue planning is where you review and update monthly room revenue forecasts and budgets. It replaces the Budget & Forecast page for Room revenue.
The forecast looks at number of room nights, Average Room Rate (ARR) and resulting room revenue. The page provides you with a pre-populated forecast based on existing data available. You can then review and make edits as needed before submitting your forecast. (We have used forecast in this article, but budget/target works the same way)
For detailed instructions on how to update a forecast or budget, read article How to edit a plan (article coming soon).
Intended users
Department Heads, Revenue Manager, Controller and General Manager.
What is the Planning process?
Following a clear planning cycle makes sure that all departments can access the latest forecast figures throughout PMI.
PMI best practice for room revenue is to review, edit and submit a Forecast monthly for the year ahead with focus on the next 3 months but this is dependent on corporate policies.
Planning process steps
- Admin user sets up a new plan, selects the time-period, the historic data or old forecast to use for reference and triggers a snapshot of Live Forecast.
- PMI uses the snapshot plus historic data to create a draft version.
- Revenue Manager or Department Heads review and, if necessary, update the pre-populated figures.
- Completed plan is submitted and updates the Forecast throughout PMI
How to access this screen?
The planning screen is currently accessed from the Budget & Forecast page when you choose the division Rooms and the relevant department that contains your Room revenue (typically Reception or Front Office).
Room revenue forecasts can only be edited and submitted through the new Planning page. Access this from the Budget and Forecast page by using the view toggle.
Switch to Yes to access the new Planning page
Switch to No to view in the old Budget and Forecast page.
What is on the Planning page?
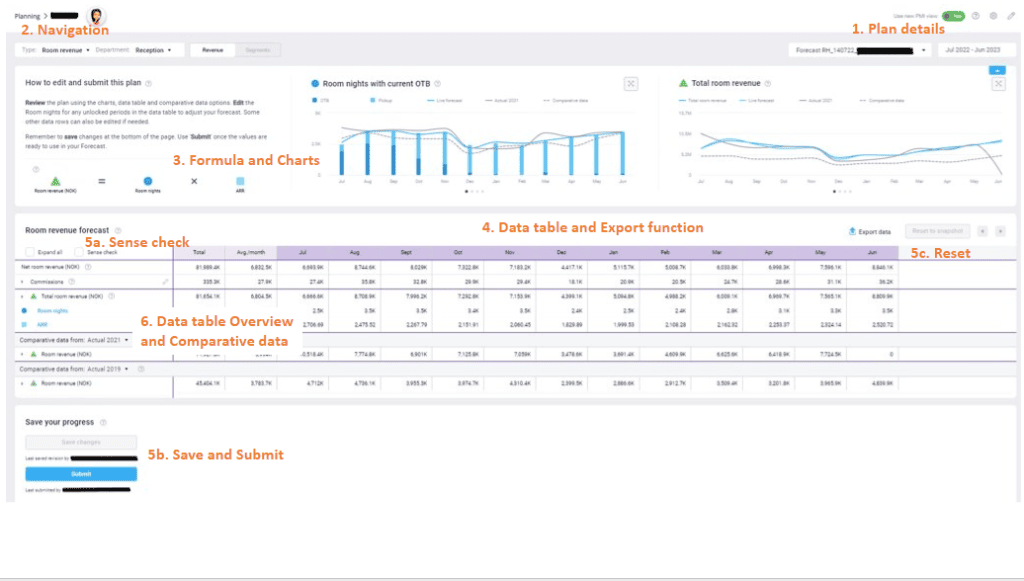
This article gives a summary of the different elements on the Planning page numbered in this picture.
Further details about the specific elements of the data tables are given in the sections Revenue Page: Data table overview and Segment Page: Data table overview.
Remember you can also get similar information in the screen at any point by selecting the help icon for the element you are interested in.
1. Plan details
The top right of the page shows the forecast name and period it covers.
- This forecast has been set up by in advance by an Admin User and these settings cannot be amended.
- PMI best practice is for Department Heads to always work in the most recently created forecast. This will be selected by default.
2. Navigation
Here you can see the department and type of revenue that this Planning page covers.
The main page, Revenue, shows the total forecast and is always available.
A second page, Segment will also be available if that option was selected by the admin user in setup.
- Click on the words to toggle between the two pages
- Note, if a Segment page is not available there will be no toggle here.
More details about choices for Segments in a plan are found in How to set up a plan.
3. Page features: Formula and Chart area
The formula box shows the calculation used to create the forecast values in this page.
- The symbols used are reflected by the same elements in the data table.
- Room revenue forecast is calculated by multiplying the number of Room nights by the Average Room Rate (ARR).
- The formula also shows the currency that is being used throughout the page.
The chart area gives a visual representation of the data shown in the table.
- Use these to see if changes to trends are in line with the same months in previous years , or if there is something that needs reviewing.
- Switch to alternative charts by selecting the grey dots below the chart.
- On the Revenue page, the left and right charts contain identical chart options and data. They can be toggled independently to view 2 charts side by side.
- Editing data in the data table below will update the charts
- The ‘comparative data’ viewed in the chart can be selected in the data table to view alternative time periods.
Further details about each chart will be available in an article COMING SOON Understanding the Revenue page
4. Page features: Data table
The data table on each page shows the forecast values month by month. Where required, figures may display in thousands (K) for easier viewing.
Some data in the tables can be edited to improve the accuracy of the forecast figures before submitting.
- Rows that can be edited are indicated with the pencil symbol.
- You cannot edit values in the past; these months are shown in the header as locked.
- Editing of Room nights and ARR is done in either the Revenue or the Segment page, not both. This is pre-set for the current version.
- Editing data in the table will automatically update any related or calculated data in the table as well as the charts. This will carry through to both Revenue and Segment page regardless of which page was edited.
For further instructions on this see How to edit a plan
Further information about the Data tables for each page are found in the sections
- 6. Revenue page: Data table Overview
- 7. Segment page: Data table Overview
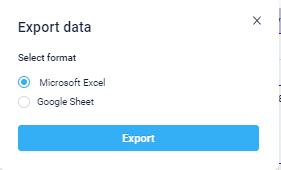
You can Export the plan at any point by selecting the ‘Export’ data button at the top right of the data table.
The export will include all data in the table for the page you are in (eg Revenue or Segment), with all rows expanded.
5. Sense check, Save and Submit or Reset Functions
Planning pages have a ‘Sense check’ function that highlights any anomalies in the data that might need reviewing.
- Clicking the Sense check option highlights any cells that are outside of the normal range when compared either to other months in that row or to similar data in one of the comparative data time-periods.
- Hovering over a highlighted cell brings up the tool tip to explain what the Sense check has found.
- Sense check is also automatically run when trying to Save or Submit changes or to leave the Planning page.
Further information about the Sense check can be found in Sense Check Mode Explanation.
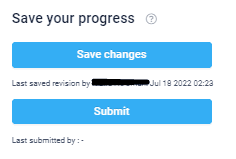
The ‘Save changes’ button will ensure your changes are saved for next time you or anyone else comes back to this plan. At this stage, the saved values only exist in this view.
In order to make the plan values available anywhere else they also need to be submitted using the ‘Submit’ button.
The latest submitted version is used in the Forecast (or Budget) throughout PMI.
- Save and Submit affect the whole plan whether they are Selected from the Revenue page or the Segment page.
- PMI shows when a version was last saved or last submitted and by whom.
- PMI Best practice is to check that the Last Submitted date is later than the Last saved revision date to ensure that all changes that should update the Forecast have been submitted.
If changes are made to the data and Saved, there is also the option to undo all changes by using the‘Reset to Snapshot’ button (top right of the data table).
- This button is greyed out until changes are Saved. It is highlighted in blue when it is an available function.
- The ‘snapshot’ is the version of this plan exactly as it was when first set up by the Admin User. This includes the Live Forecast figures that were valid at that moment in time.
- Re-setting to snapshot undoes any (saved) changes which were made to any editable rows in future months.
- Reset to snapshot cannot be ‘undone’ and any previous changes to this version would be lost.
- This will affect changes made to either the Revenue or Segment page.
- Once a plan has been submitted it can still be reset to the original snapshot. Note that this would not over-write the submitted version in the P&L and should therefore be used with caution
6. Revenue page: Data table Overview
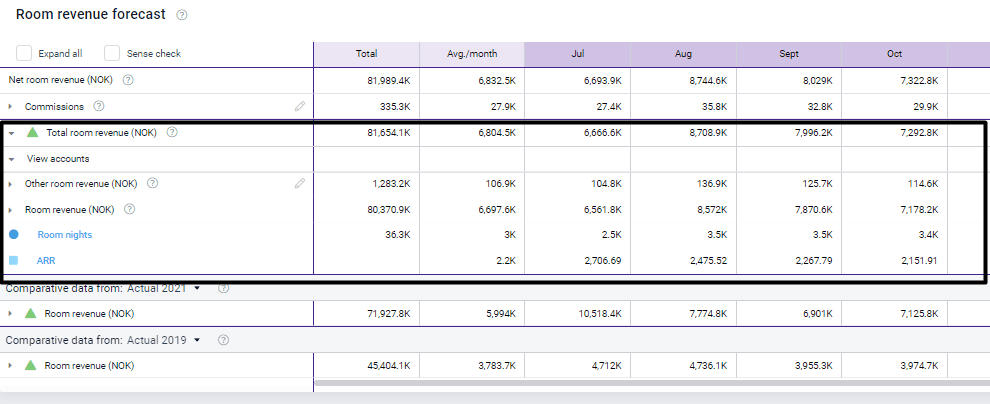
The default view of the Data table on the revenue page is a summary of the main Room revenue figures useful to the Revenue Manager or Department Head.
If you want to examine further details for the Profit & Loss (P&L) financial values, this can be found by clicking ‘Expand all’.
- Net room revenue shows the revenue after deducting commissions. The commissions, other room revenue, and room revenue that make up total room revenue are shown below
- Commission and other room revenue are estimated based on historical data. The total monthly values can be edited manually for future months. This might be needed, for example, if commission contracts have changed so that the historical basis is inaccurate.
- For more detail see the article COMING SOON Room revenue planning: Calculations explained.
The second section of the data table is the detail under Total room revenue
It typically shows the revenue (by account) as well as the Room nights and ARR data.
If this data should be edited in the Segment page, click the blue hyperlinks for Room nights or ARR to jump directly to this.
The extra detail seen by expanding rows shows how the total room revenue will be split between the financial accounts in the Profit & Loss (P&L). These details are not shown in the above screenshot.
Further details about how these links can be set up and how to review the information in them can be found in the article COMING SOON: Room revenue planning: Calculations explained
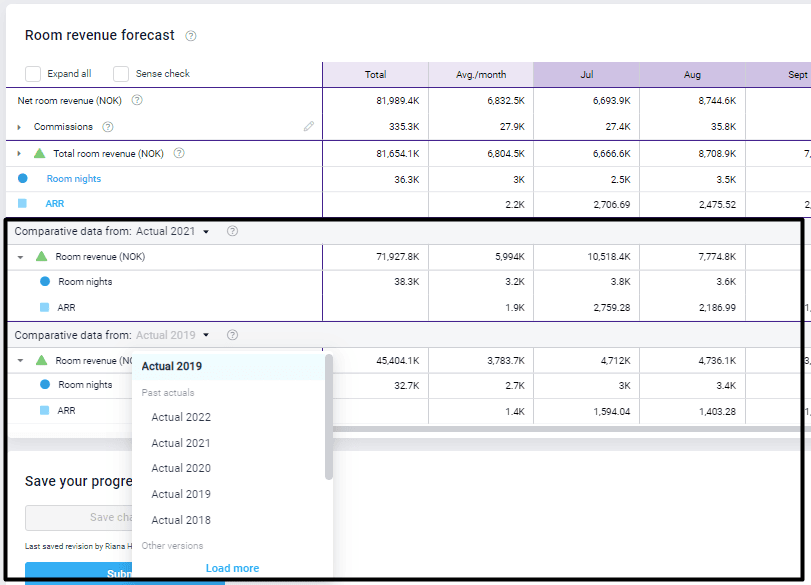
The third section of the table is the Comparative Data.
There are two purposes for the Comparative data:
- To calculate future (forecast) figures based on historical trends
- To compare the current plan (historical and forecast) to a previous time-period and allow more accurate forecasting to take place.
The 1st set of Comparative Data shows Last Year as the default (in this case: Actual 2021).
The default for the 2nd set of Comparative Data is selected by the Admin User when setting up the current plan.
The drop-down list enables you to select a different time-period for either Comparative Data set. This enables you to make comparisons quickly without leaving this page. The charts will also update to display the new selection.
By default, the second comparative will show the dataset used for pre-populating splits between accounts, level of commission or anything else not available from Live Forecast. This comparative is selected by the admin user as part of setup for each version.
Further details about the Comparative Data selection can be found in the article COMING SOON: Room revenue planning Comparative Data explained.
7. Segment page: Data table Overview
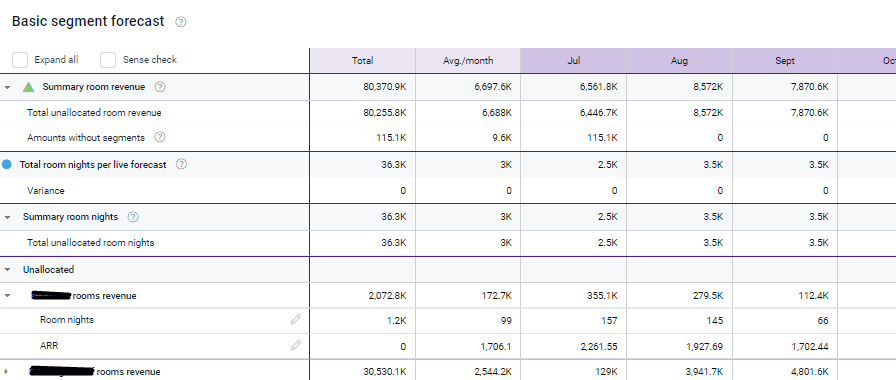
The segment page details the underlying Room revenue data which is held at Segment level in the Live Forecast for your chain or property.
The totals and comparatives are still available on the Revenue page.
Where the current plan has been set to allow editing of the data at Segment level, this will be done in the Segment page only and not in the Revenue page.
Editing the segment page automatically updates the Revenue page including any charts.
The layout and functionality of the Segment page follows the same principles as the Revenue page.
For details on how to Set up Segment Groups and Segment Mapping see the article COMING SOON: How to set up a Plan: Segments and Segment Groups.


